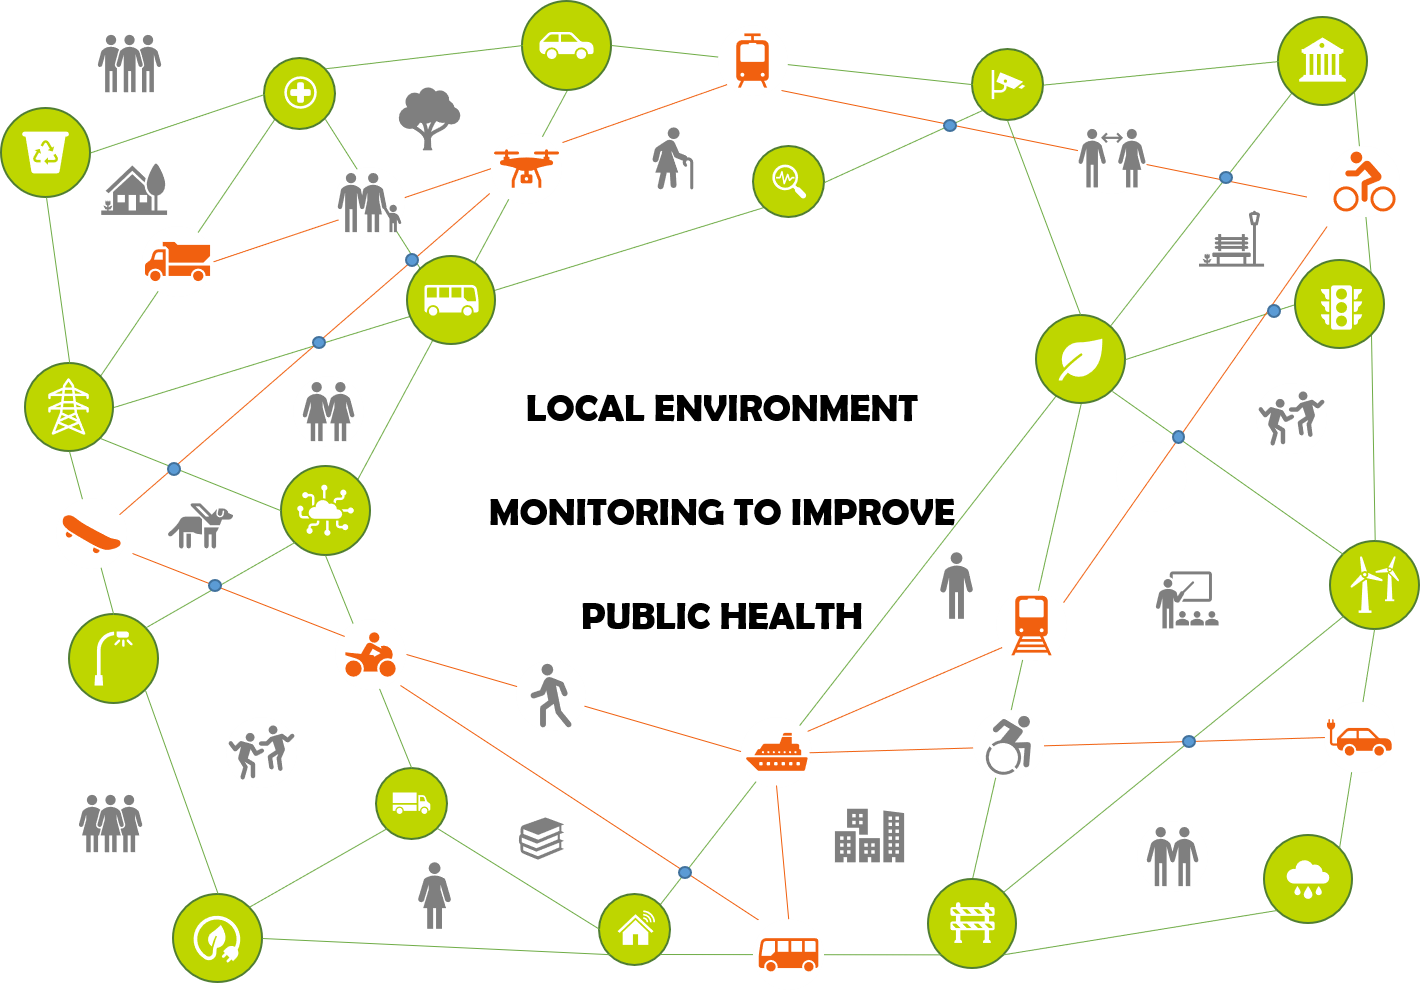
Post lockdown priorities for local government: local environment monitoring to improve public health

As we glimpse the first signs of life after COVID-19 it is time to consider what the new priorities will be for cities, regions and communities. For local government it is an opportunity to resume the mantle of some existing priorities such as improving air quality, reducing traffic impacts and addressing issues such as public health. However, there are real challenges to resume these priorities with hard hit budgets and struggling workforces. So how can local government deliver local environment monitoring, improve public health and manage costs? The answer lies in better data management, busting data out of silos and bringing it together to inform interventions and policy choices. [ui!] UrbanPulse urban data platform will help local government do just that.
[ui!] UrbanPulse does this through combining your various data sources such as weather, air quality, noise pollution, traffic flow, smart lamppost and noise sensors, into one platform to create an overview of local conditions in real time. Not only will all the data be in one place, but the right data and analysis will be there. This will remove the time taken to analyse data sets and come to conclusions and instead allow teams to work on solutions to meet the desired outcomes. Keeping data in their siloes and away from each other limits the knowledge and insights you can gain. By bringing all meaningful data into one platform you will be able to make decisions and see outcomes based across your data sources, not on a one-by-one basis. You may also find out other positive and negative benefits you had not anticipated because of the actions you take.
The data that you see in [ui!] UrbanPulse is real time. Furthermore, the data can be presented in ways that work for you, from overlaying on a map, to a pulse monitor for key KPIs, as well as a wide variety of graphs and charts provided within tiles. Our [ui!] COCPKIT dashboard provides you with an overview of the entire city, with all your key metrics within one place, while also allowing you to dive deeper into each data source, for instance to find historical data and future patterns, with simple click through actions. The map view allows you to see your location-based data in its physical setting, this is particularly useful when analysing the relationship between different data sets such as traffic speed and air quality.
By applying our advanced analytics, you can identify trends such as pollution hotspots. This empowers you to implement measures, backed by data, to meet your environmental targets and support public health. By utilising the diverse data sets within [ui!] UrbanPulse we can apply machine learning and artificial intelligence to cross domain problems, such as the correlation between air quality and traffic speed or smart lighting, traffic numbers, availability of parking and noise pollution for example. By integrating analysis of diverse data sets, you can get more accurate trends, patterns and forecasts than any standalone sensor provider. With no more data siloes, you can have a holistic view of the impact actions in one area have in another. This will result in more collaboration, communication and an improvement in problem solving.
Our platform provides real time complex event detection, enabling us to recognise in real time complex situations which need to be reported or actions taken upon. An example scenario could be a combination of weather, traffic patterns, time of day, a local event and parking availability, leading to a significant unusual spike of air pollution at the site of a school at the end of the day. Through leveraging detection and prediction of events using a diverse data set we can recognise and take preventative action on unusual events which can occur for complex reasons.
In summary, [ui!] UrbanPulse allows local environment monitoring to improve public health as it brings together all data relating to the local environment and exposes how they interact with each other. From here monitoring and reporting is simple and allows you to measure the impact of your initiatives and share the results, improving your resident’s quality of life.
If you would like to hear more about this, please contact me